TIL: cmd + 9 to select last tab

I keep Gmail and my calendar in the first two tabs of my browser and often use cmd + 1 or cmd + 2 to jump to them. The shortcuts continue, with cmd + 3 selecting the third tab, cmd + 4 selecting the fourth, and so on. I rarely jump to the fourth or seventh tab and never the ninth. But cmd + 9 doesn’t jump to the ninth tab, it goes to the last, which I actually want quite often. That’s the stuff I opened most recently!
cmd + option + left and cmd + option + right navigate between tabs if you’re close to the one you want.
TIL: Change the timezone for a command with TZ
The TZ environment variable changes the selected timezone for the duration of a command (or at least commands that are aware of TZ). It’s handy to use with the date command:
$ date
Tue May  5 09:34:58 EDT 2026

$ TZ=UTC date
Tue May  5 13:34:58 UTC 2026
I actually added alias utc="TZ=UTC date" to my shell so that I can double-check the time when I’m looking at logs with UTC times.
TIL: WhatsApp has per-conversation member tags
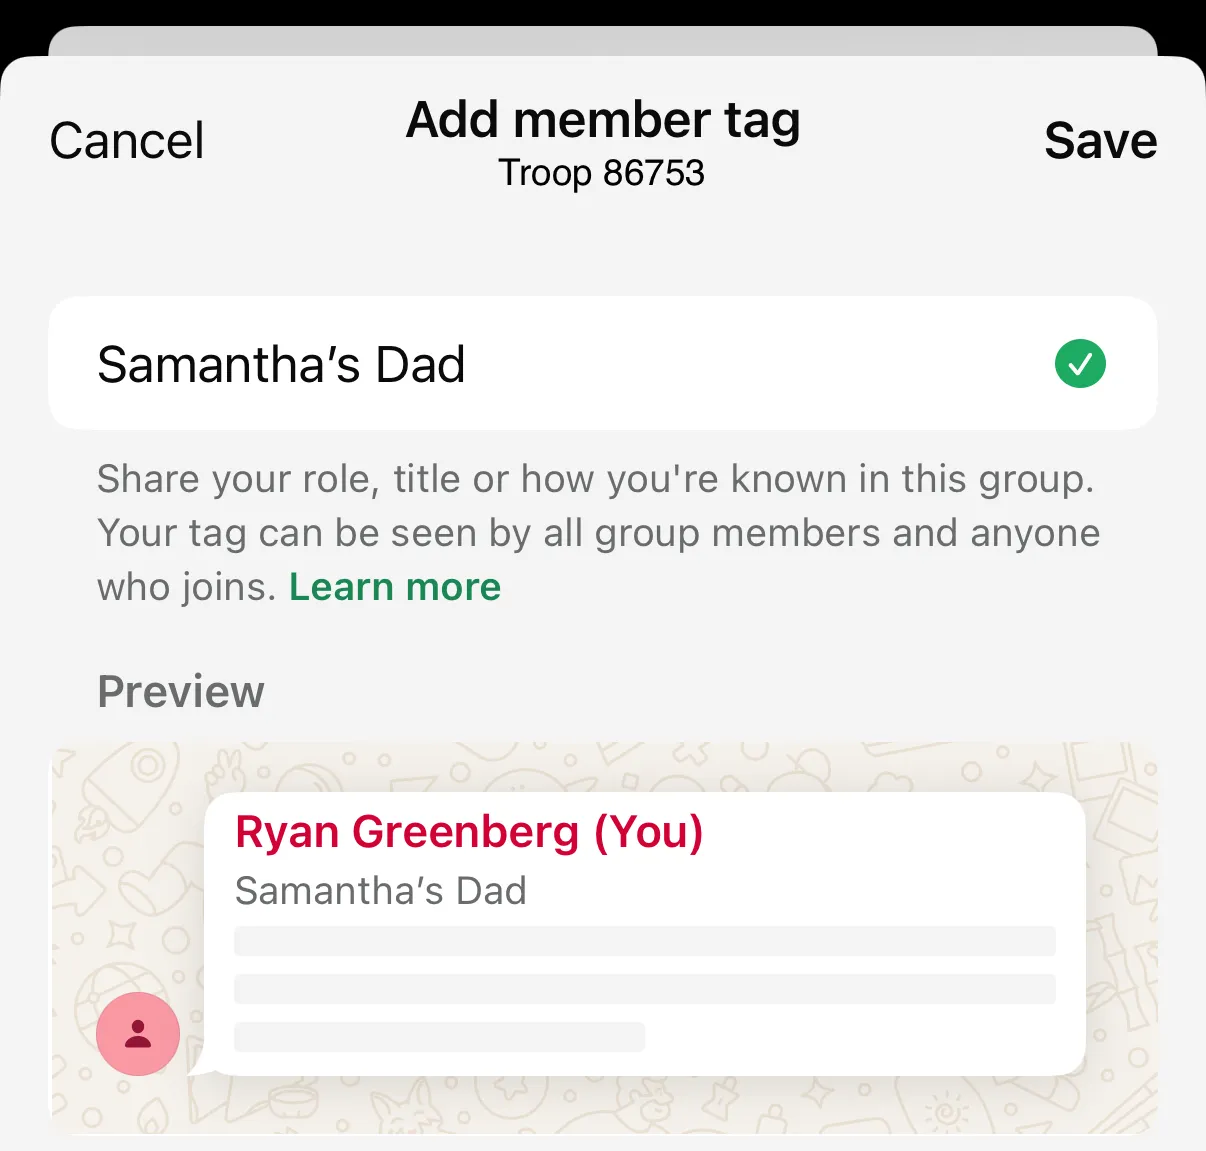
I’m part of several WhatsApp chats for my kids: one for each class, one for each activity. Each of them is filled with dozens of parents and in many cases I want to know “whose parent are you?” Some parents actually change their name to include their children’s names. This morning in one of the chats I saw one parent’s name and underneath “Daniel’s Mom”. What’s that?!
It’s a new-ish feature launched in January 2026: member tags. You can set a description that appears alongside your name for each individual conversation. This way in the soccer chat I can mark myself as a coach, and in each classroom chat I can mark myself as the relevant child’s parent.
Scroll to the members section of the chat details, then tap “Add member tag” to edit.

More details on the support page (which is blank for “Web”; presumably the feature isn’t available there yet)
TIL: cmd + tab has a bunch of extras
On macOS cmd + tab brings up the application switcher. “Yes,” you say, “I have used a computer before.”

But there are a bunch of extras!
- if you keep the cmd key depressed, you can use
tab,shift + tab,~, the left/right arrow keys, or even the mouse to select the application to activate. - press
qwhen an application is selected to quit the program - press
hwhen an application is selected to hide it - press up/down when an application is selected to show all its windows in an Exposé view
- if you are dragging a file, you can drop it onto an icon in the switcher (I can’t say I’ve ever used this one. I typically drag-and-drop to the Dock but maybe there are cases where the application switcher is more convenient)
3D printing in five acts
Act I: I do not buy a 3D printer
This is how it started: a Black Friday sale. If you saw the prices I saw, I’m quite certain you’d say what I said: “Ryan, with deals this good, can you afford not to get a 3D printer? If you don’t buy one now, imagine how much money you’ll lose buying it later. They’re practically paying you to buy a printer!”
I was ready to click “buy” but then the other half of my brain arrived. “Ryan,” it said gently, “have you ever purchased anything thinking it would blossom into a hobby only to find yourself making a sheepish, Hemingway-esque ‘For Sale, Barely Used’ post on Facebook Marketplace months later?” The more responsible neurons had a point. Of course I have. I pumped the brakes and went looking for a post-desire justification. What would I actually do with a 3D printer? I found a list of 100 popular prints and saw that 80% of them were fidgets and other plastic trinkets. I don’t need a trinket machine! I have kids! I live in the trinket factory!
So I didn’t buy a 3D printer.
Act II: I do buy a 3D printer
By this time, the algorithms had unfortunately discovered that I was curious about 3D printing. I kept seeing videos about interesting and useful prints. Several months later, Bambu Lab introduced the X2D. Several reviews praised it, raved about its capabilities, with one reviewer even saying they’re surprised it doesn’t cost more. I can only resist temptation so many times! (once).
A few things tipped me over the edge:
- The kids. I thought it would be fun to do projects with them. It’s a cool thing and they like cool things! I’d like to avoid becoming a plastic junk factory, but I’m willing to be a little flexible if they can use it creatively.
- Gridfinity. I’m a sucker for organization. I have a bunch of junk drawers that the Container Store alone cannot solve and this is a way to build flexible organization.
- I love learning new stuff from scratch and I like the idea of solving problems around the house with new tools.
So I bought a Bambu Lab X2D.
Act III: Using a 3D printer
It’s kind of magical to watch an object come into existence. I can see why people get sucked into printing!
I’m surprised how much there is to learn (in a pleasant way). My understanding is that printers today are much easier than 10-15 years ago. They do lots of things automatically: calibration, bed leveling, detecting when something has gone quite wrong. And yet there’s still lots of stuff to figure out and do. There are different types of filaments—PLA, PETG, ABS, TPU and their properties; different types of software (CAD, slicers); and basic knowledge like how to remove a print from the plate, what temperature you should do it, how to maintain the machine.
That said, the learning curve is pretty gentle. My daughter and I unboxed the machine, set it up, and did a test print in an evening. Shortly after, the machine asked me to lubricate some rods. But the frowning robot on the screen was accompanied by a QR code to a wiki and videos. You can start by downloading other people’s models and printing them. There are tons of learning resources online. Bambu Lab Academy has tons of official videos; YouTube has more tutorials than you could ever watch.
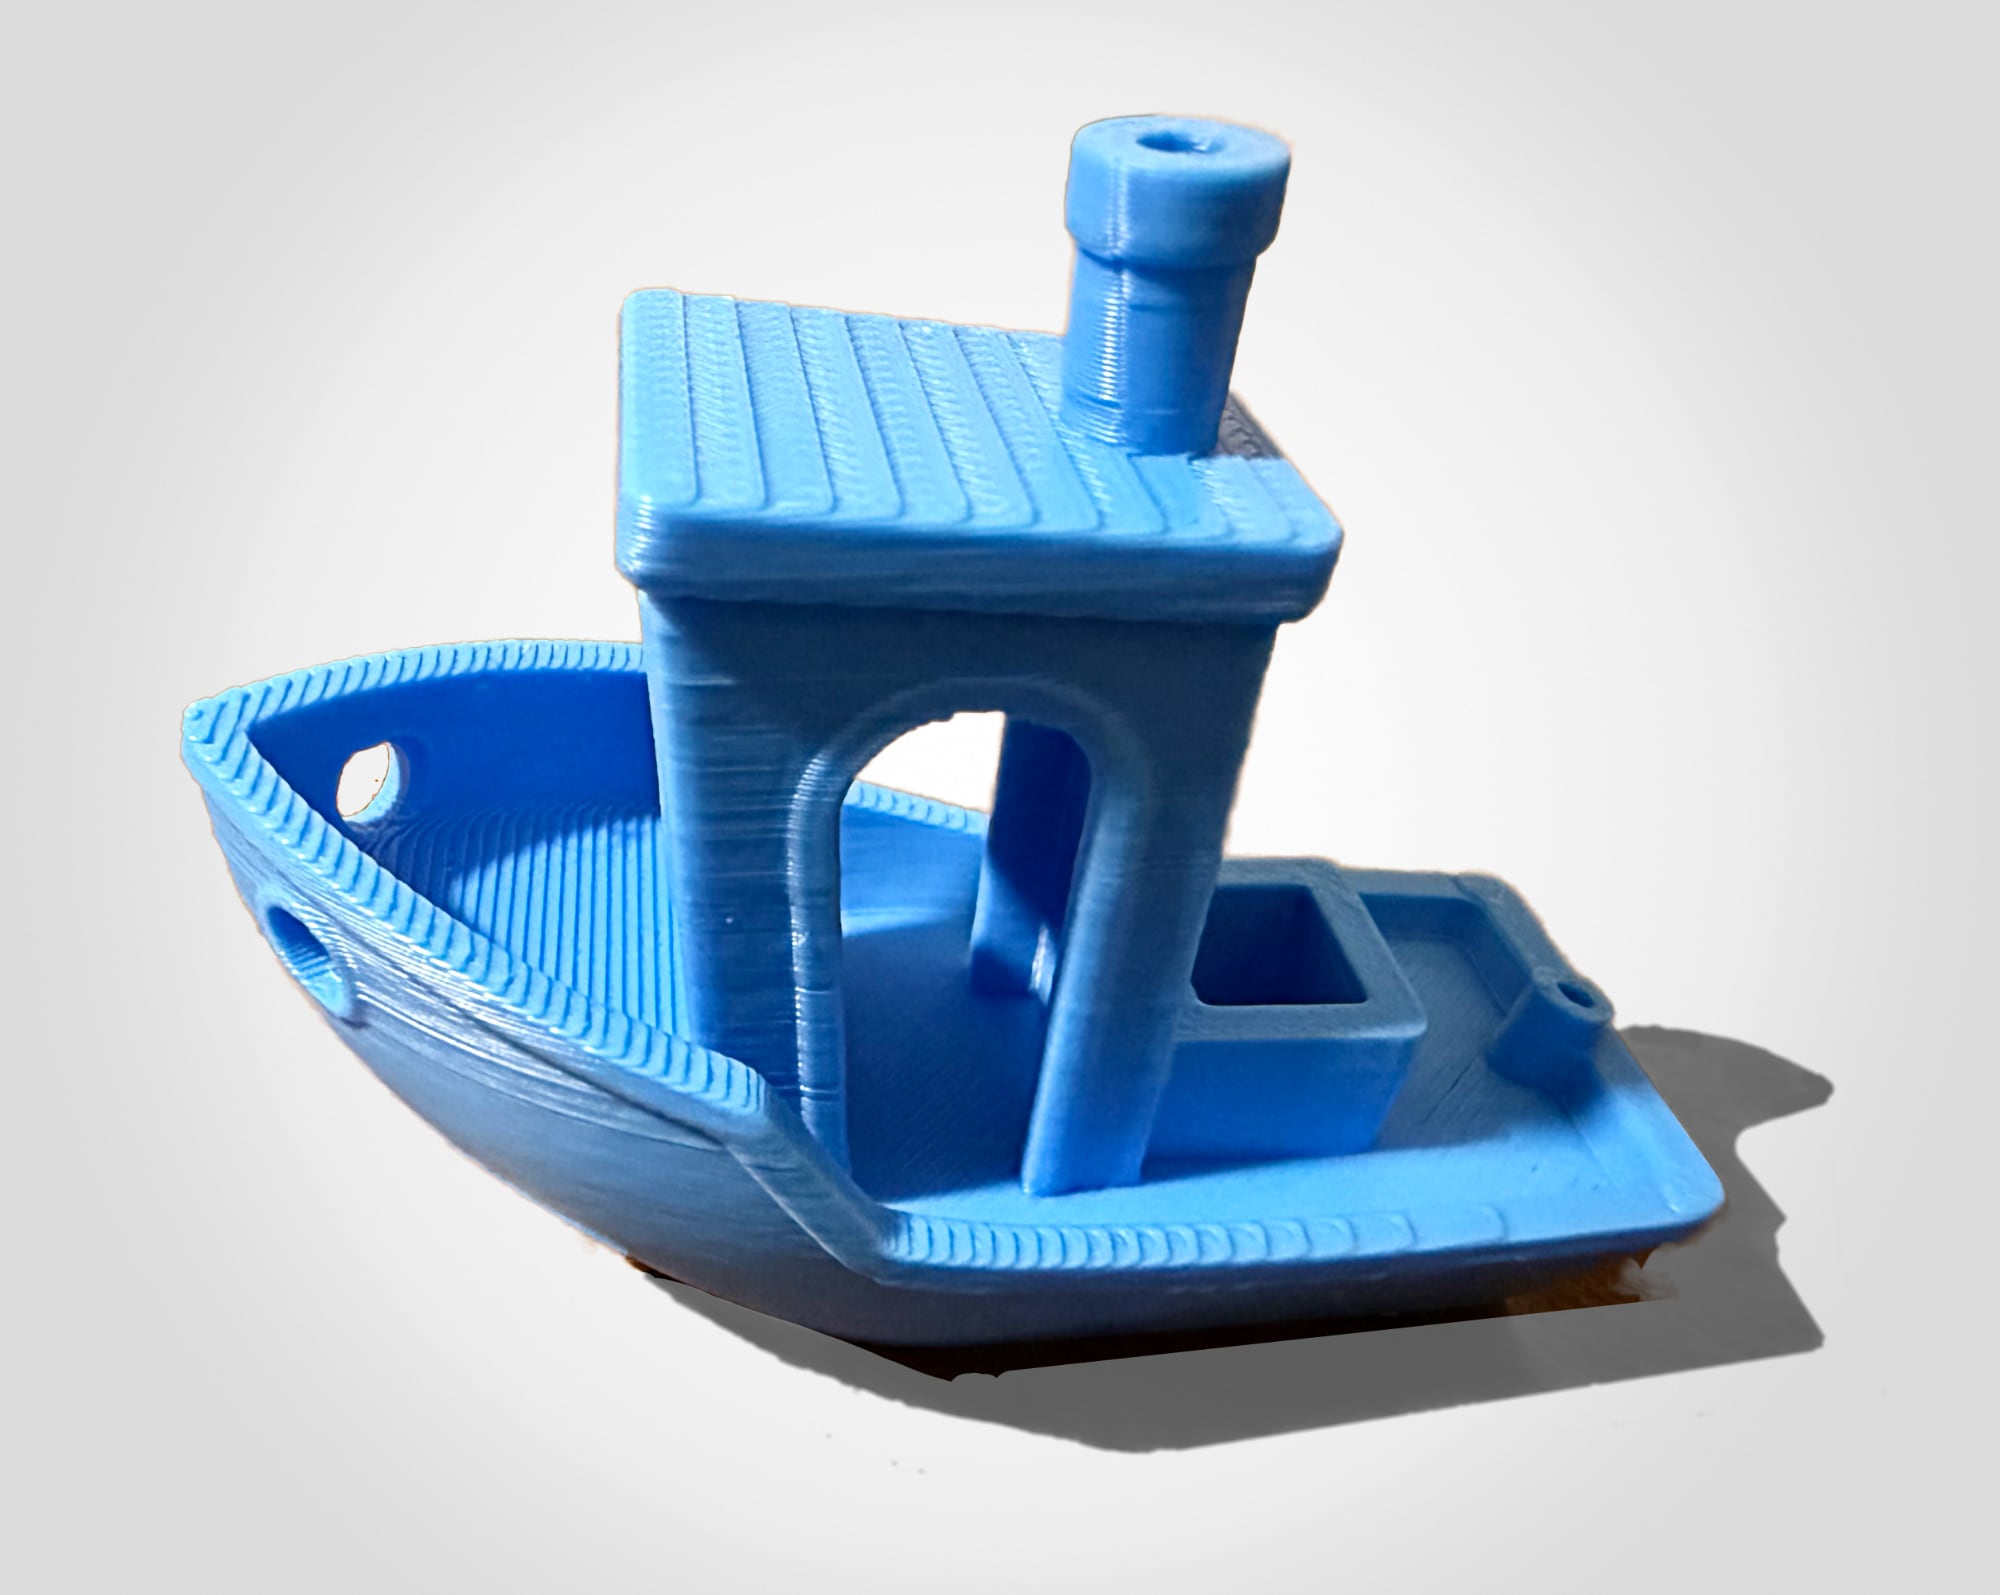 Benchy, a boat, is often used as a test print. This one is ours.
The bit where you print things for your printer is a little meta. Do you want a toolbox for these items? Click here to print one. Wild! Need an extra spool for your filament? Need a poop chute? Want a swatch of filament colors? Print, print, print. I hope not to spend all my time printing things for my printer. That feels like the adult version of the kids’ fidget toys. (But yes, I did print all of the things listed here).
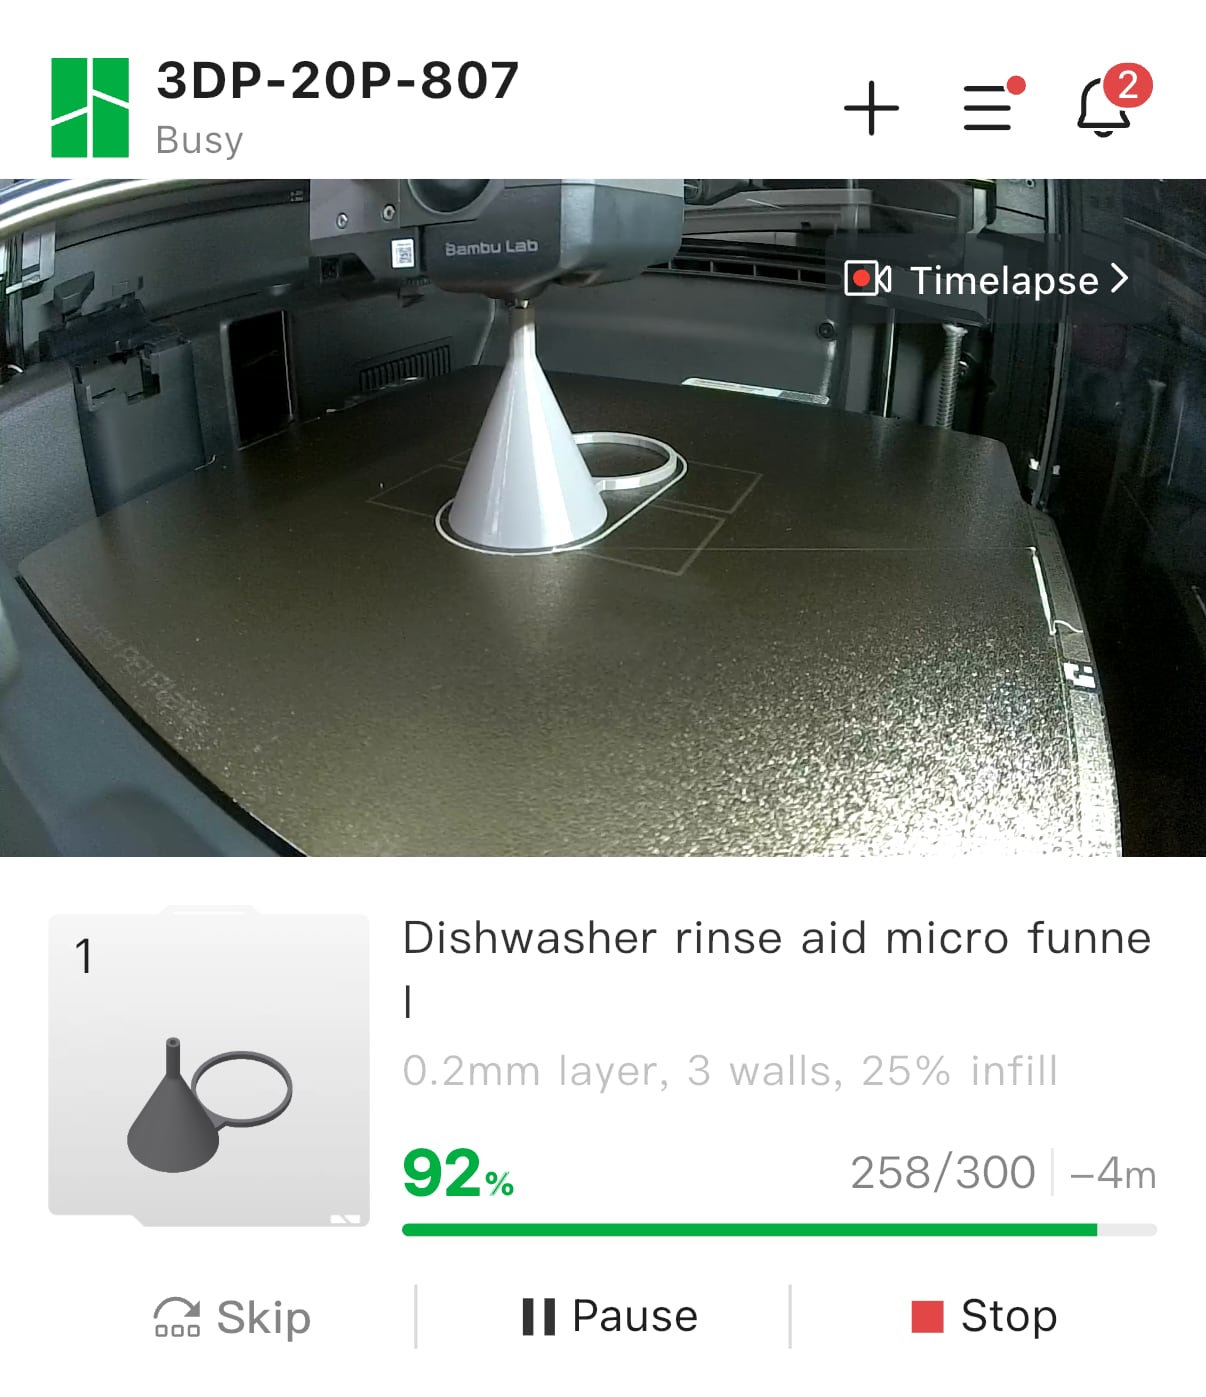
I also did some prints to get the rest of the family on board. For example: a tiny funnel that attaches to a JetDry rinse aid bottle and makes it easier to pour. (In every household there is one person who refills the rinse aid. I’m embarrassed to say that in mine it’s not me).

My younger daughters each picked a design and color and printed one of these cool bookmarks.

(I highly recommend them. They only take ~15 minutes, they feel delicate, but are pretty resilient.)
Act IV: Gridfinity
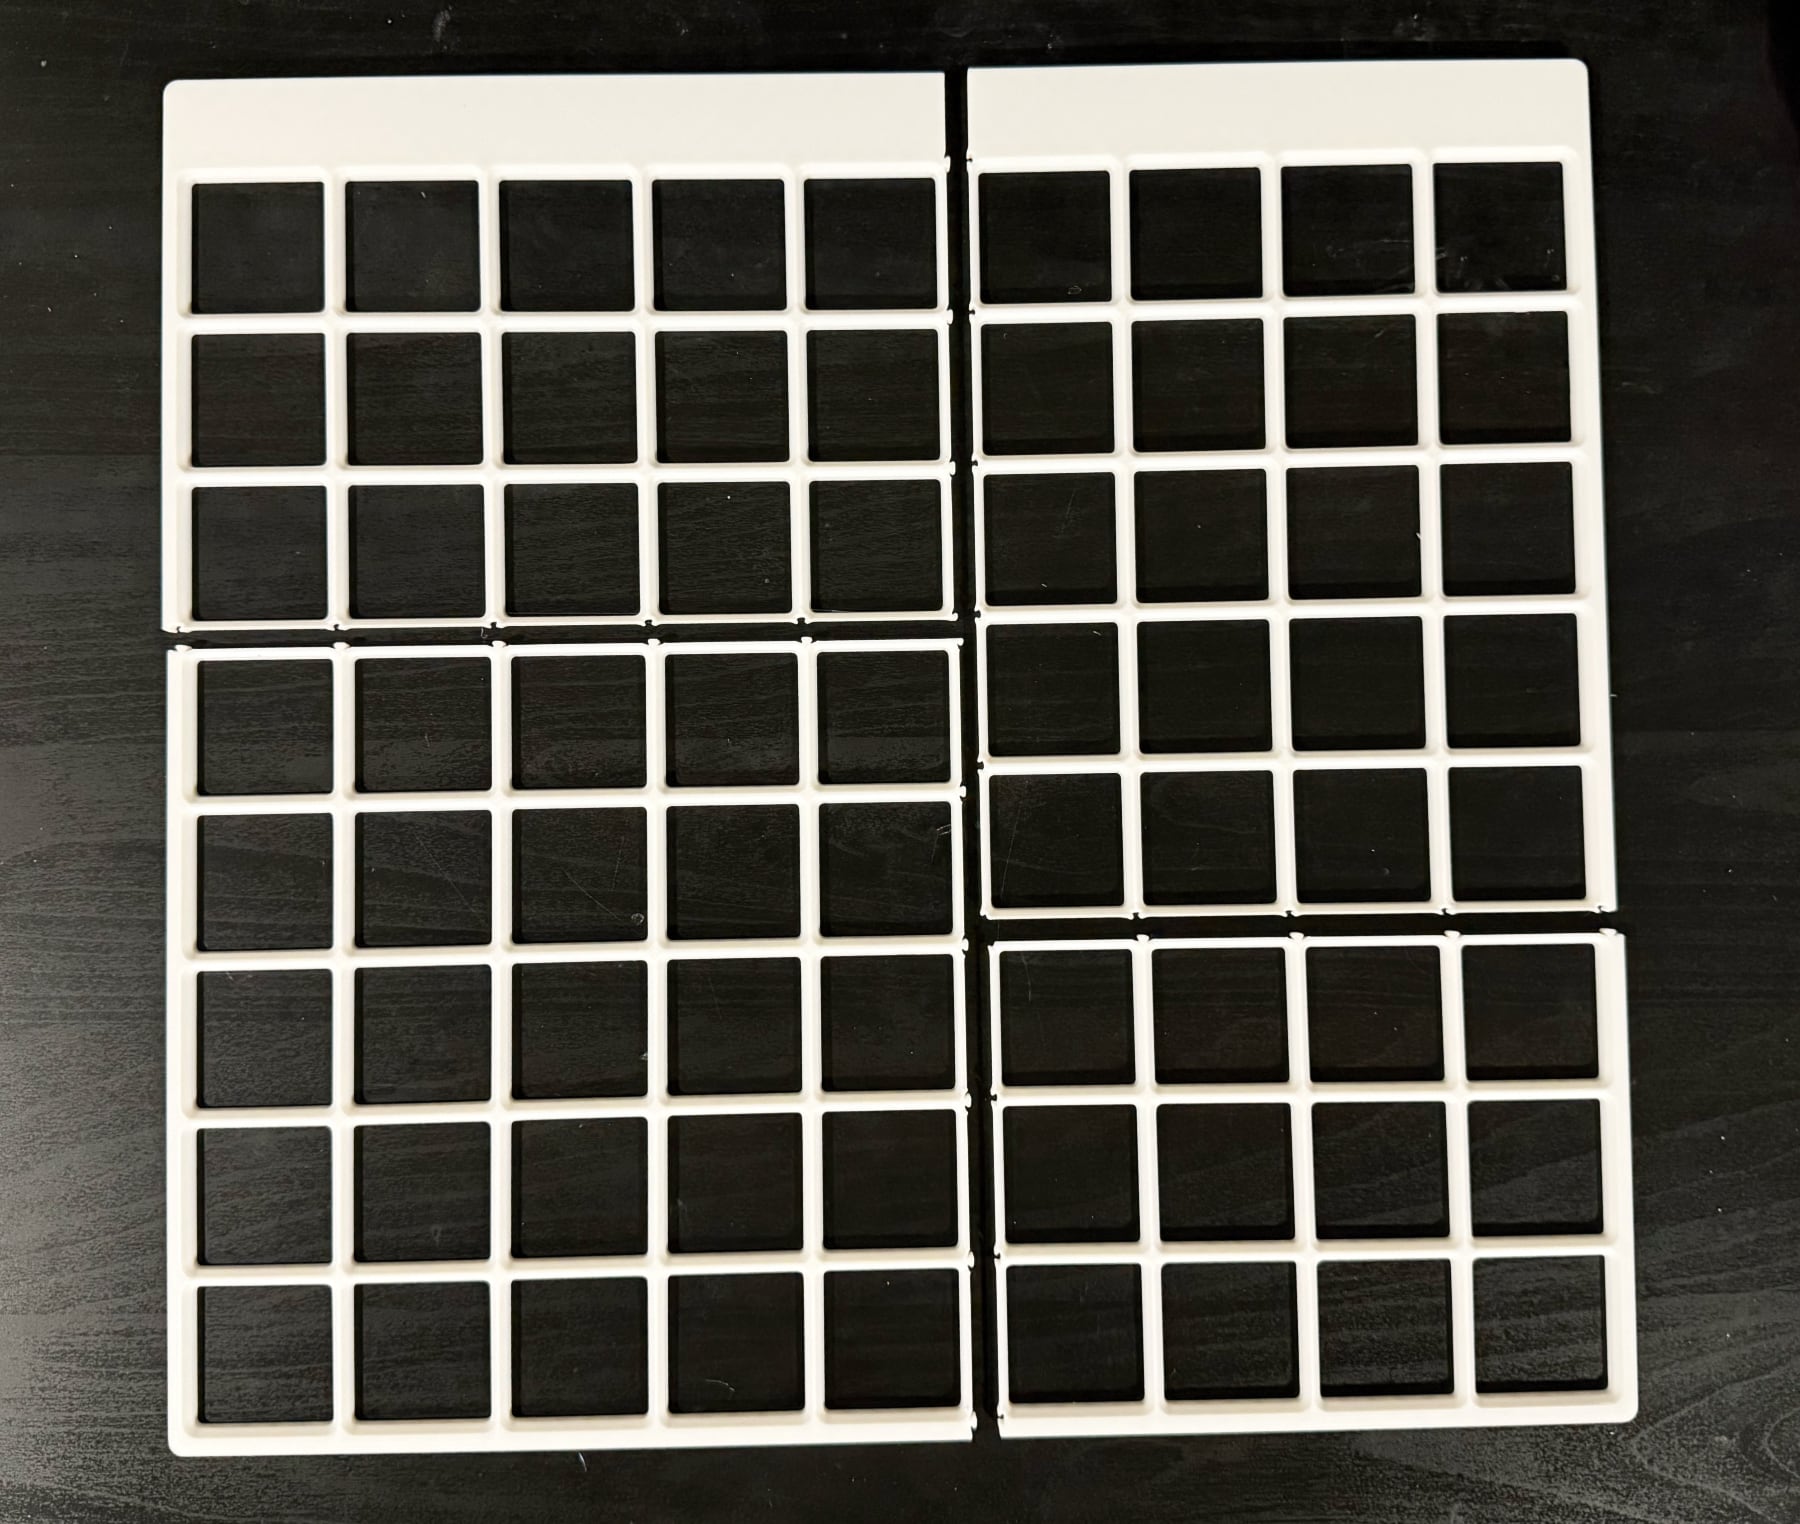
Gridfinity is one of the reasons I bought a printer, so I wanted to make myself actually try it early on. The short explanation of the system is that you measure a space, print a grid with 42mm slots, then print variable-size containers that sit in those slots. Some people have designed bins for specific tools (like a pair of pliers or SD cards).
The first drawer I tackled was in the bathroom. I had a false start because I did the math wrong, but it was a good lesson on the importance of correct math. These are the steps I used (warning—boring):
- I measured the drawer interior with a tape measure and a laser measure.
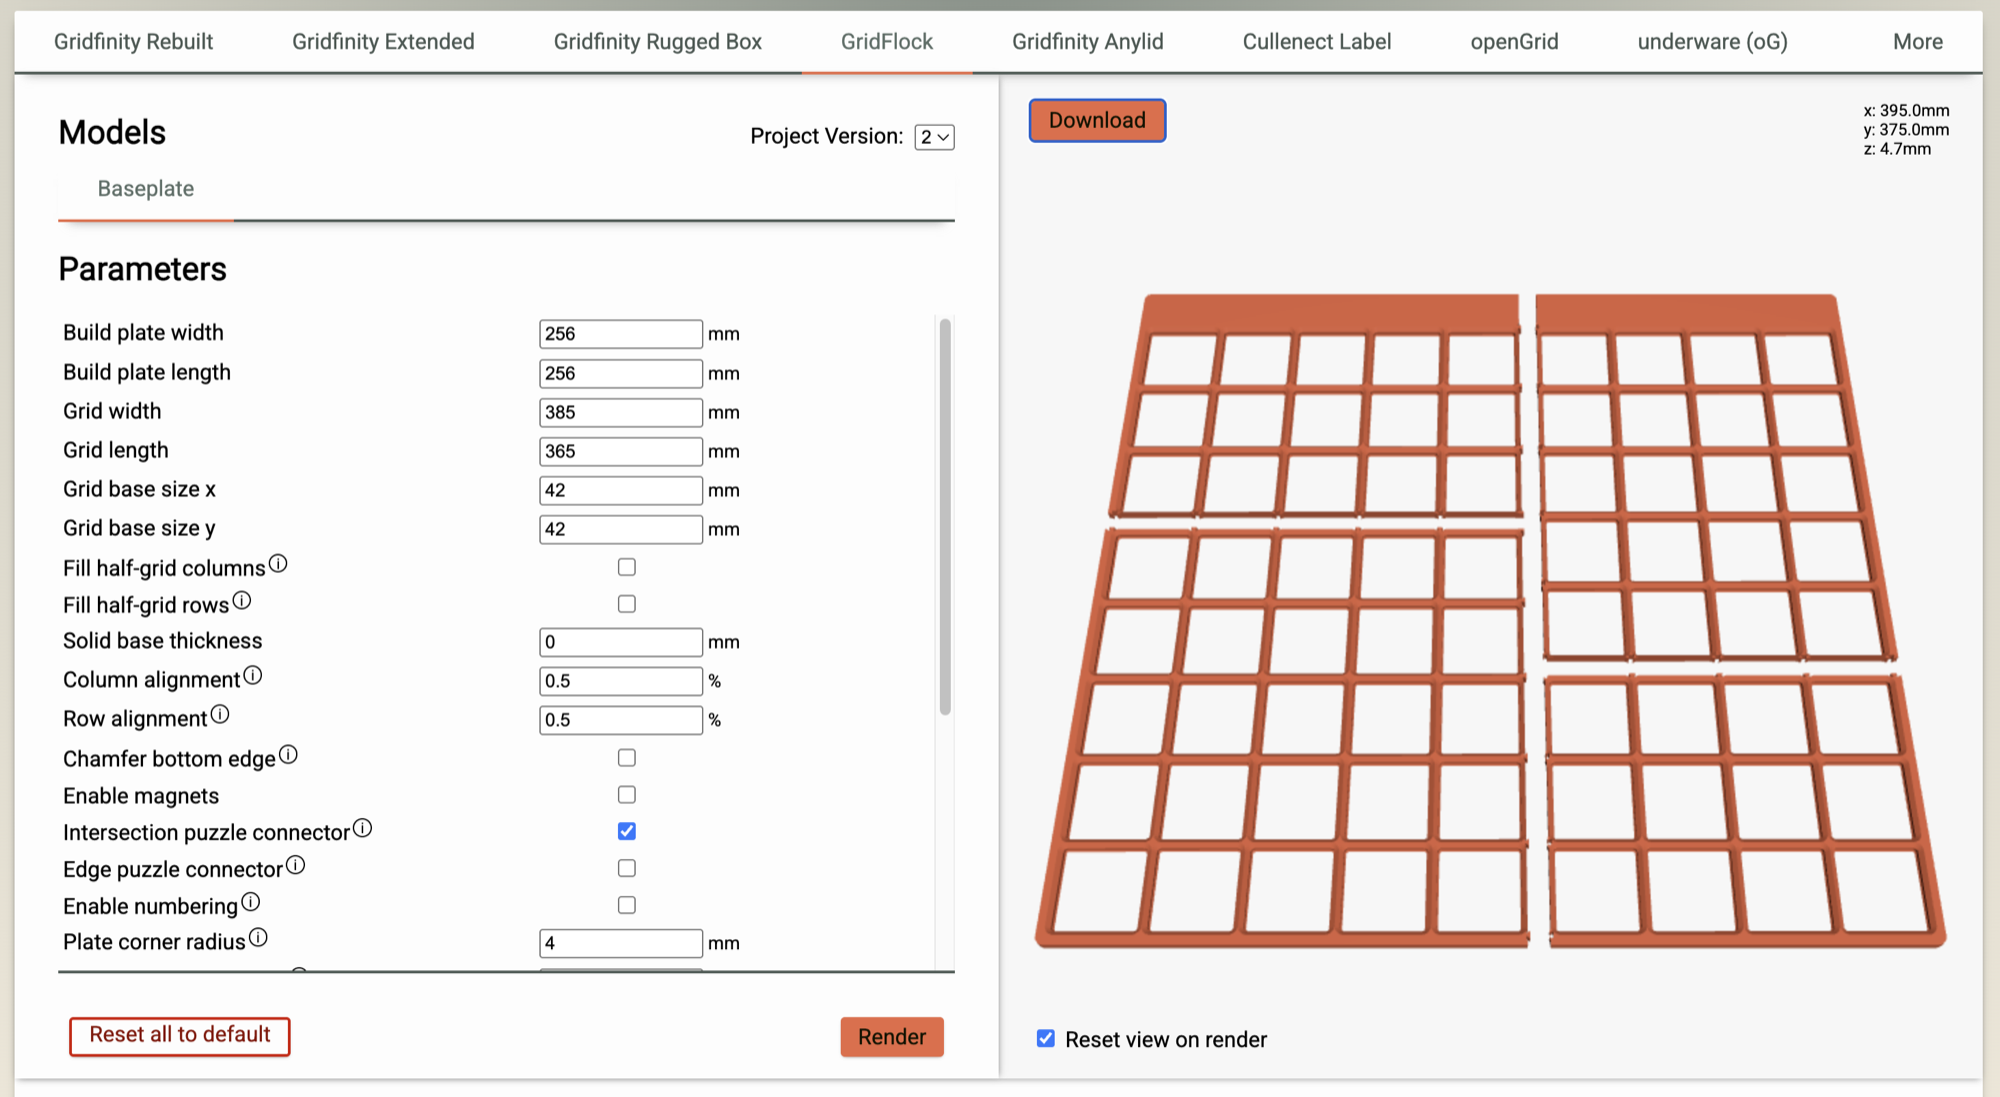
- I used the Perplexing Labs generator to make the base plate. I used GridFlock, magnets disabled, no half-width rows/columns, and added an offset to shift the extra “padding” towards the back of the drawer.
- That gave me an STL file that I opened in Bambu Studio. I right-clicked the model and selected Split → To Objects. Then I got a warning about the objects not fitting onto the print plate. Which made sense—they did not.
- I assigned each object to a separate print plate (which feels analogous to a sheet in Excel).
- I adjusted the quality settings to lower quality / faster prints. (I set global quality to “0.20mm Standard @BBL X2D”)
- I clicked slice, picked my filament, then clicked print.
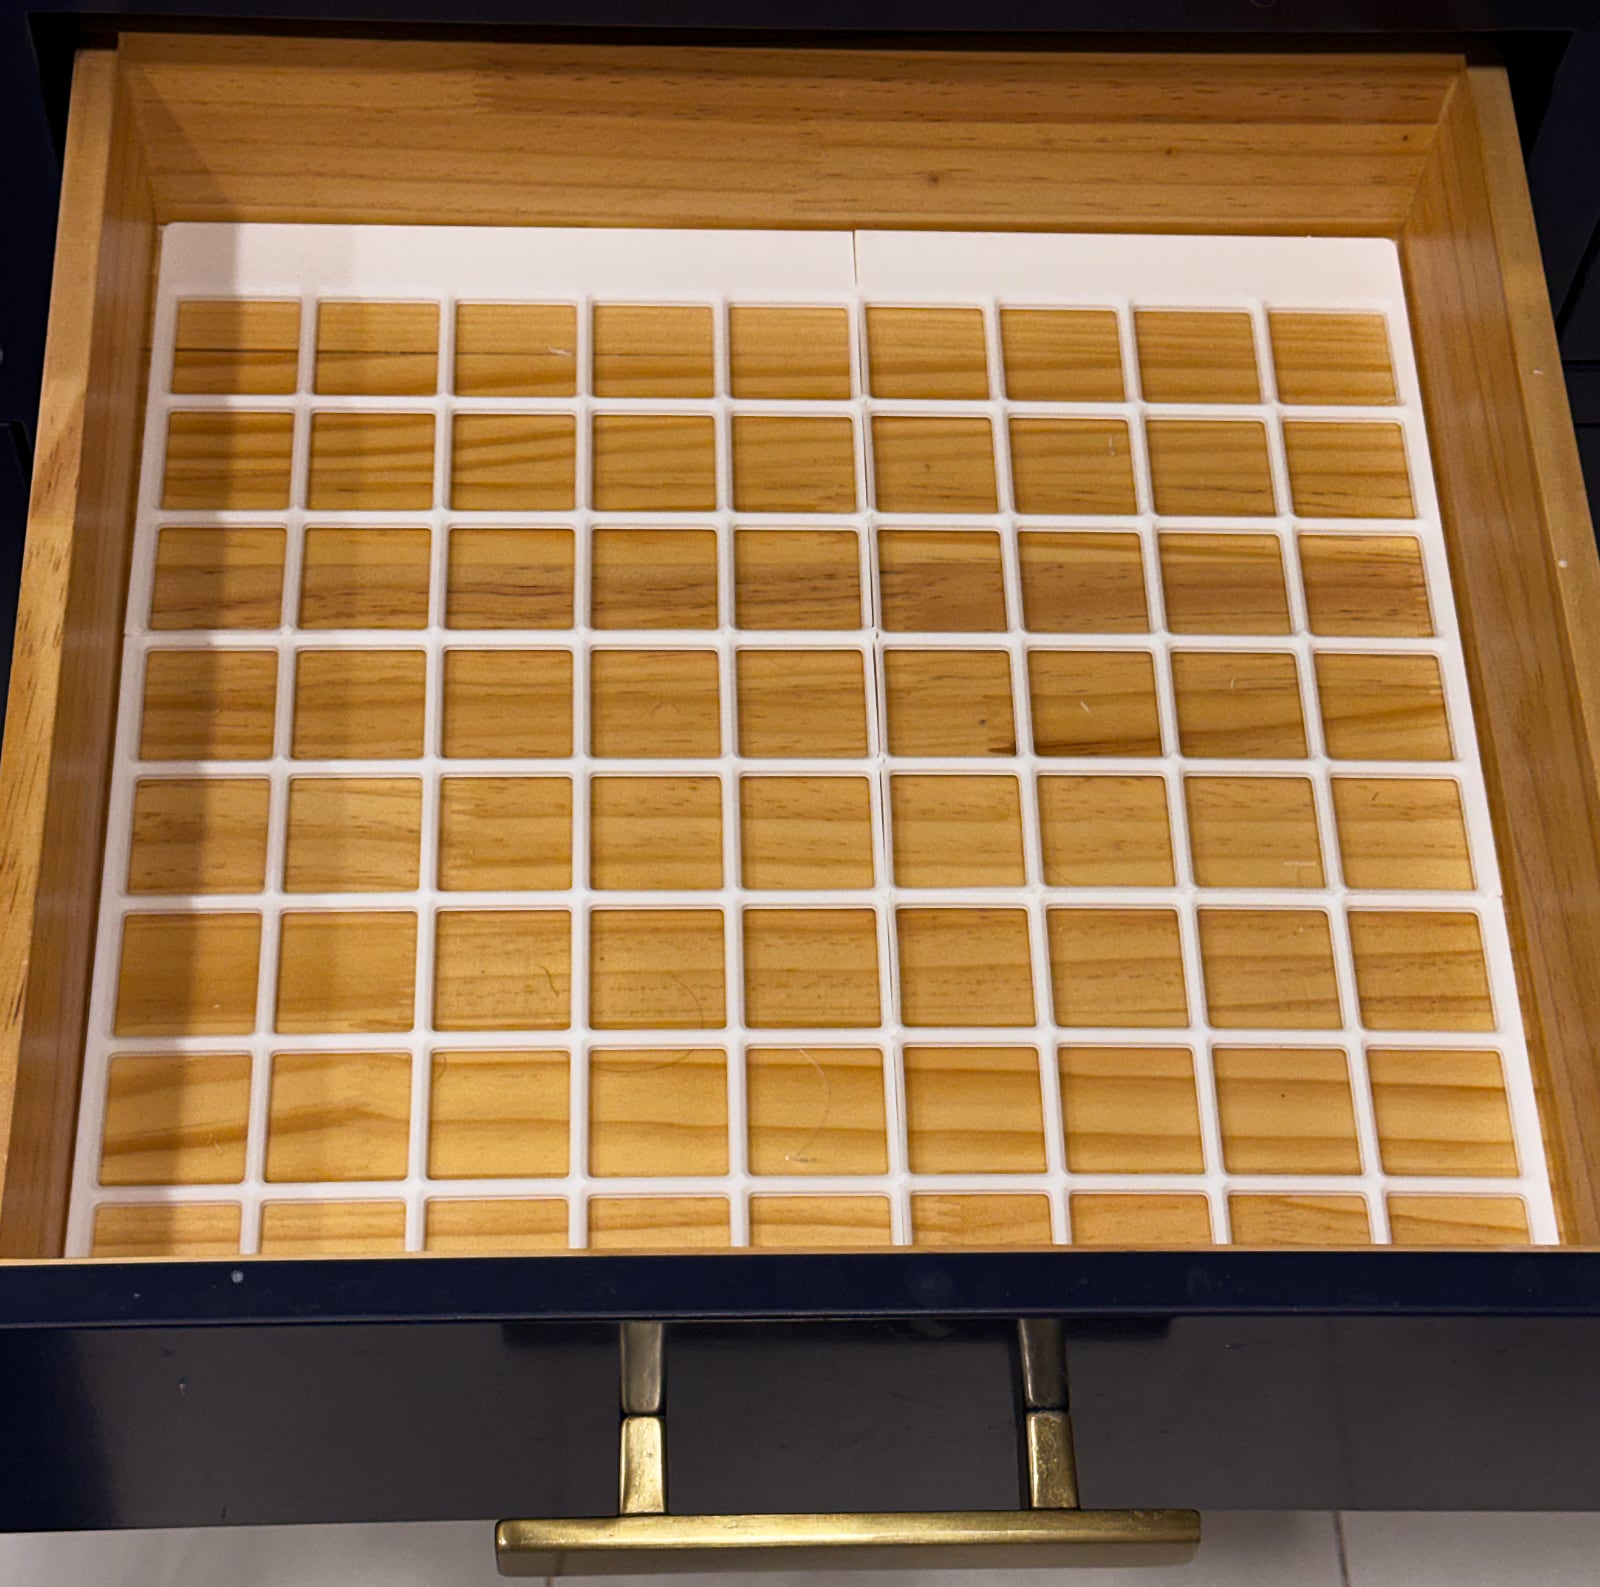
It was pretty amazing to hold something physical that previously existed only on my screen. After printing the grid and fitting it together, I laid out my toiletries and decided which size bins to print. I used Perplexing Labs Gridfinity Rebuilt with no magnets, stacking lip, or label tab.
A few things I learned:
- Printing takes time—longer than I expected—even for simple things. Each of the 4 pieces of my base plate took ~50 minutes. A set of several bins might take 4 hours. It’s almost enough to make you want a second printer.
- Deciding on the exact layout and z-height of bins was tricky because I wasn’t sure how it would feel to use them at different sizes. I had to remind myself “Done is better than perfect, you’re learning, we can always print something different later.”
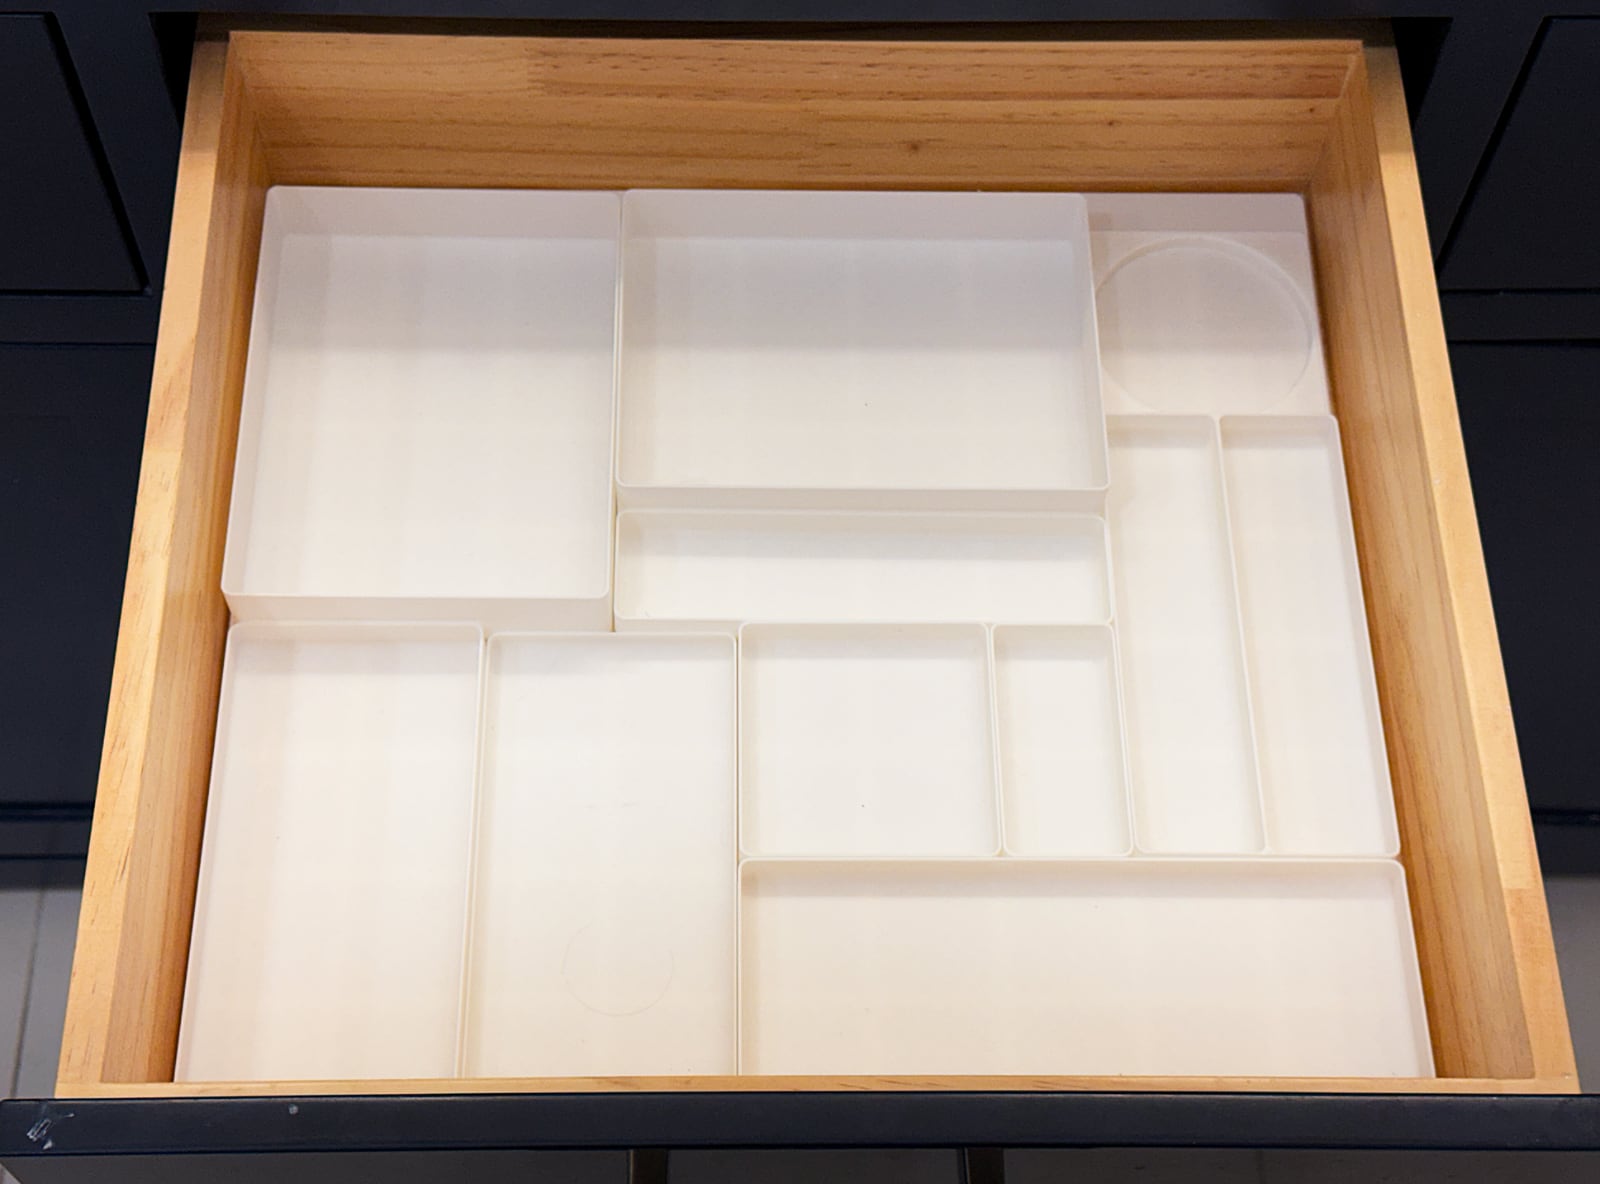
Overall, I’m pretty happy with the results. I’d like to experiment with custom bins and more vertically oriented organization.
Act V: What’s next
You could enjoy a 3D printer just downloading and printing existing models. There’s a lot of cool stuff out there! For me, though, part of the appeal is totally custom stuff where I can solve a problem that’s unique to me. My next goal is to learn some modeling software, probably a combination of Autodesk Fusion and OpenSCAD, and print something I make myself. I’d also like to find a way to get my kids more involved, whether it’s Tinkercad or turning their artwork into designs.
I will probably print more Gridfinity (Would I download a drawer? I sure as hell would!)
If I convinced you to buy a printer, that’s exciting! and/or I’m sorry.
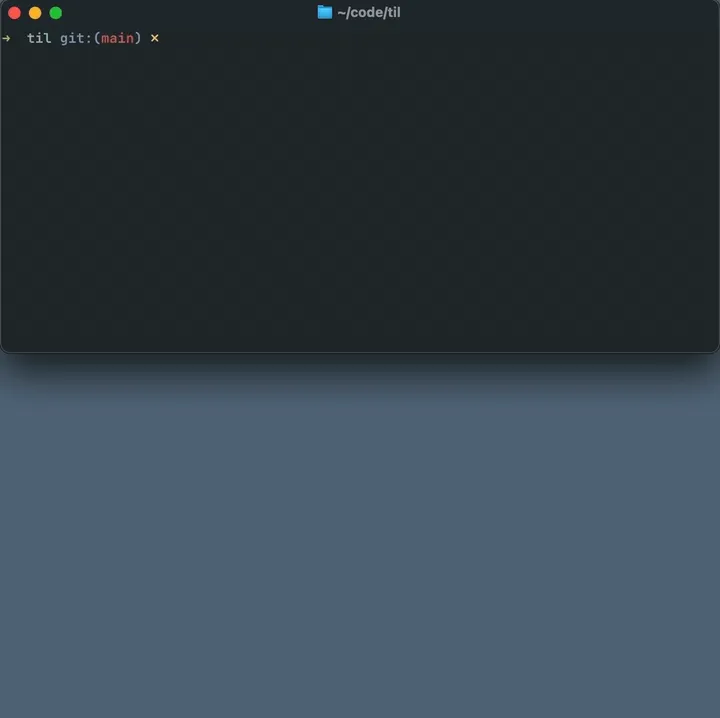
TIL: git checkout - for last branch
I move back and forth between two branches somewhat often in git (“The tests are failing on my branch—are they failing on main?” (They were not)).
I found git checkout - which is great for this. It checks out the branch or ref that you were on most recently. It reminds me of cd -, which switches to your most recent directory. Running this multiple times will bounce you back and forth between the branches.
$ git checkout -b git_commands
Switched to a new branch 'git_commands'

$ git checkout -
Switched to branch 'main'
Your branch is up to date with 'origin/main'.

$ git checkout -
Switched to branch 'git_commands'
I grew up in the era where git checkout was the command you used for five different things. Git 2.23 introduced git switch explicitly for switching branches. git switch - works the same way.
TIL: box, qbox modes for sqlite3
I love SQLite. It’s an amazing piece of software and there are so many cool things you can do with it. It comes with sqlite3, a command to work with a database interactively. Out of the box, sqlite3 formats query results poorly.
For example:
sqlite> SELECT * FROM weather LIMIT 5;
2026-01-01|EWR|35|20
2026-01-02|EWR|32|21
2026-01-03|EWR|32|20
2026-01-04|EWR|38|27
2026-01-05|EWR|37|24
The output has no headers and the pipes aren’t great separators. If you’re used to psql or mysql, this is worse.
You can make things better by running these commands (or putting them in your ~/.sqliterc):
-- Show column headers in results
.header on

-- Show results in MySQL-like columns
.mode table
sqlite> SELECT * FROM weather LIMIT 5;
+------------+---------+----------+---------+
| date | airport | day_high | day_low |
+------------+---------+----------+---------+
| 2026-01-01 | EWR | 35 | 20 |
| 2026-01-02 | EWR | 32 | 21 |
| 2026-01-03 | EWR | 32 | 20 |
| 2026-01-04 | EWR | 38 | 27 |
| 2026-01-05 | EWR | 37 | 24 |
+------------+---------+----------+---------+These results are easier to read and similar to what you see in other database CLIs. They can be a bit of a mess with lots of columns or very long values, but that’s understandable.
SQLite 3.53 was released recently and has some big changes to query result formatting, which are exposed as improvements in the .mode command. From “Default Output Formats”:
As of version 3.52.0 (2026-03-06) the default format is:
- Show query results in a table composed from Unicode box drawing symbols. (“box”)
- Quote all output as SQL literals, except do not quote text literals when it is not necessary to disambiguate them. (“—quote relaxed”)
- Attempt to automatically squeeze the output table so that it fits within the width of the display. (“—screenwidth auto”)
- Truncate multi-line values to show only the first 5 lines. (“—linelimit 5”)
- Truncate long values to show only the first 300 characters. (“—charlimit 300”)
- Truncate column titles to 20 characters. (—titlelimit 20)
- When displaying a BLOB that is really JSONB, show the equivalent JSON text rather than the BLOB value. (“—textjsonb on”)
Now it can squeeze the entire table and columns to fit the available space and truncate long values. The new .mode box and .mode qbox use fancy unicode characters (qbox quotes values to distinguish their type; note that the strings below are quoted).
sqlite> .mode box
sqlite> SELECT * FROM weather LIMIT 5;
┌────────────┬─────────┬──────────┬─────────┐
│    date    │ airport │ day_high │ day_low │
├────────────┼─────────┼──────────┼─────────┤
│ 2026-01-01 │ EWR     │ 35       │ 20      │
│ 2026-01-02 │ EWR     │ 32       │ 21      │
│ 2026-01-03 │ EWR     │ 32       │ 20      │
│ 2026-01-04 │ EWR     │ 38       │ 27      │
│ 2026-01-05 │ EWR     │ 37       │ 24      │
└────────────┴─────────┴──────────┴─────────┘

sqlite> .mode qbox
sqlite> SELECT * FROM weather LIMIT 5;
┌──────────────┬─────────┬──────────┬─────────┐
│     date     │ airport │ day_high │ day_low │
├──────────────┼─────────┼──────────┼─────────┤
│ '2026-01-01' │ 'EWR'   │ 35       │ 20      │
│ '2026-01-02' │ 'EWR'   │ 32       │ 21      │
│ '2026-01-03' │ 'EWR'   │ 32       │ 20      │
│ '2026-01-04' │ 'EWR'   │ 38       │ 27      │
│ '2026-01-05' │ 'EWR'   │ 37       │ 24      │
└──────────────┴─────────┴──────────┴─────────┘
Although the documentation says this new mode is the default, I still see .mode list as my default so I set .mode qbox in my .sqliterc.
TIL: cal for a command-line calendar
When I’m in the terminal and need quick access to a calendar I run cal.
By default cal shows you the current month with today highlighted:
$ cal
     April 2026
Su Mo Tu We Th Fr Sa
          1  2  3  4
 5  6  7  8  9 10 11
12 13 14 15 16 17 18
19 20 21 22 23 24 25
26 27 28 29 30
cal -3 will show you a 3-month calendar, with the previous, current, and next month.
$ cal -3
     March 2026            April 2026             May 2026
Su Mo Tu We Th Fr Sa  Su Mo Tu We Th Fr Sa  Su Mo Tu We Th Fr Sa
 1  2  3  4  5  6  7            1  2  3  4                  1  2
 8  9 10 11 12 13 14   5  6  7  8  9 10 11   3  4  5  6  7  8  9
15 16 17 18 19 20 21  12 13 14 15 16 17 18  10 11 12 13 14 15 16
22 23 24 25 26 27 28  19 20 21 22 23 24 25  17 18 19 20 21 22 23
29 30 31              26 27 28 29 30        24 25 26 27 28 29 30
                                            31
cal [year] shows you the whole year.
Try cal 9 1752 for a particularly unusual month.
TIL: Use open to open in other applications
The open command on the macOS CLI lets you open things in another application. By default, it uses the application that corresponds to the file type as determined by LaunchServices. You can specify a different one with -a:
open index.html # opens in Chrome, my default application for *.html
open -a "Sublime Text" index.html
open -a "Safari" index.html
One great use for this is with directories. The Finder is the default application for them, which means you can easily open your current directory in the Finder with open . (some things are easier in a GUI!) .
If you need to go the other direction (Finder to terminal), you can drag a file into the terminal window or copy/paste it.
TIL: tee to see output and save it
What if you want to watch the output of a command and save it to a file? For a long time, when faced with this need I would run the command, redirect it to a file with >, and tail that file in another tab:
bundle exec rspec ... > output # save to file
tail -f output                 # view it on the screen
It turns out this is the reason tee exists. tee takes standard input (stdin) and writes it both to the given file and standard output (stdout). Instead do:
bundle exec rspec | tee output(Remember that stderr is not copied across pipes so if you want to write it to a file, you will need 2>&1 to redirect stderr to stdout: [command] 2>&1 | tee).
Bonus TIL: I didn’t really get why the command is called tee, but then I found out it’s a reference to a tool from plumbing of all places: the tee pipe fitting. A tee pipe fitting splits the flow of water or gas in a pipe (see Piping and plumbing fitting, “Tee”). By analogy, tee splits the flow of data between commands connected via pipes (|).

        ─────────────────────────
              ___ ____ ____
stdin ────▶    |  |___ |___   ────▶  stdout
               |  |___ |___
        ─────────┐     ┌─────────
                 │     │
                 │  │  │
                 │  │  │
                    ▼
                 [file]
(mind exploding GIF here)
TIL: Pretty-print column-based data with column -t
I wanted to share some tab-separated data in Slack but it was hard to read:
File  Unchecked Partial Checked
chat.php 7467 910 2333
job_queue.php 4025 194 726
reminders.php 4989 274 1411
unfurl.php 3739 383 1328
users.php 5631  454 1669
I had already sent a few of these snippets and was tired of manually aligning them. I was on the verge of writing a script to format the data for me when I thought “surely there is something that does it?”
There is! It was a bit hard to figure out how to search for it, but eventually I found column. From the manual:
 column -- columnate lists

 -t      Determine the number of columns the input contains and create a table. Columns are delimited with whitespace, by default, or with the characters supplied using the -s option. Useful for pretty-printing displays.
I can’t say that I’m familiar with the verb “columnate” but it works like a charm.
$ cat data.txt | column -t
File           Unchecked  Partial  Checked
chat.php       7467       910      2333
job_queue.php  4025       194      726
reminders.php  4989       274      1411
unfurl.php     3739       383      1328
users.php      5631       454      1669
By default column works with any whitespace-delimited separator, whether it’s tabs or spaces. Note that on the macOS version of column you need a newline at the end of your text or it will drop the last line.
TIL: Table names and indexed access types
TypeScript has some powerful type system features that I haven’t seen in other languages. I recently learned about indexed access types, which let me rewrite some code to make it easier and safer to use correctly.
I have a UI prototype that makes SQL queries to the backend, then casts the response objects to the corresponding data type for the queried table. It looks something like this:
await selectAll("repos") as Repo[];

async function selectAll(table: string): Promise<Row[]> {
  return select(`SELECT * FROM ${table}`);
}
where repos is the name of a table and Repo is a type we codegen from the schema representing a row (yes, the sql string building is Not Best Practice—it’s a prototype!). Good APIs make it easy to get things right and this one falls short in two ways: you can get the table name wrong and you could make the wrong type assertion.
Fixing the table name problem is easy enough. We can codegen an enum or union type for the known tables. But that still leaves the problem of getting the cast right.
In other strongly typed languages, this is where I would flail around for a while and try to get something working. Typically it ends with some tradeoff between usability and safety where the author needs to specify more information. But in TypeScript it turns out to be easy to solve if we codegen a type like this:
export type TableTypes = {
  repos: Repo,
  searches: Search,
  // ...
}
With just that type, you can rewrite selectAll like this:
async function selectAll<T extends keyof TableTypes>(
  table: T,
): Promise<TableTypes[T][]> {
  const rows = await select(`SELECT * FROM ${table}`);
  return rows as TableTypes[T][];
}
The type parameter T uses keyof so the table parameter must be a key of the codegen TableTypes. This means that selectAll("reops") with a typo will fail to typecheck.
The second bit, which was new to me, is using the variable T to index into TableTypes for use in the return type annotation and type assertion. This is TypeScript’s indexed access types, which let us express that the return is the type associated with that key.
With this we can write const repos = await selectAll("repos") and TypeScript automatically infers Repo[] without any additional assertions.
Today I Learned
One of the blessings of working with computers—though it is not universally described as such—is that you get to learn new things constantly. For years, I’ve kept notes about things I learned. I wrote them scattered across text files, in Notational Velocity, and on my phone. Here’s a random file from my first software internship:
RUBY REMINDERS

Variables
---------
local
@instance
@@class
$global
This is really basic stuff but you have to start somewhere!
When I worked at Slack, I created a #cli-pro-tips channel and started to write up the notes I had accumulated as a kind of mini-blog. I posted an entry every day for weeks. Other people added theirs too, which I loved. Now I wish I hadn’t locked all that writing up inside a company that I don’t work for anymore, but that’s just another lesson.
A bunch of people have been sharing things like this in a format called TIL, “Today I Learned.” I think Josh Branchaud’s collection is one of the oldest. I also really enjoy Simon Willison’s and Julia Evans’s TIL sites.
I really like this practice of learning in public. It shows that even experienced people are still picking up new things. Sometimes when we hear that someone else doesn’t know a thing, we react with a kind of feigned shock. But there’s so much stuff to learn! Of course everybody has missed some of it.
I remember once at a work dinner I mentioned how ctrl + r in your terminal shell lets you search through your history (this is a typical conversation, I’m a great guest, please invite me). Another person said “Wait—what?” And I took a lot of joy in explaining it because this person was one of the best engineers at the company—much more talented than I am—and I got to share something they didn’t know. xkcd has a great strip about this:
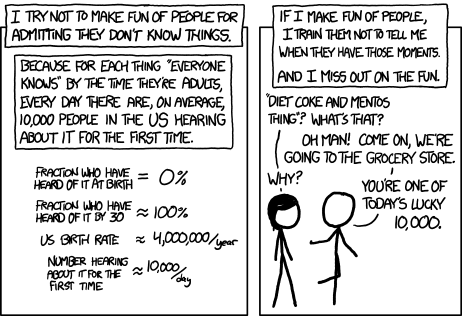
In that spirit of learning and sharing, I’m adding a TIL section to my site. I’m trying to revive some of those old lessons from my notes alongside new ones. I hope you’re surprised by some of the things I didn’t know yet and learn something new yourself.
TIL: Window functions
I was really excited to learn about SQL window functions because you don’t learn new concepts very often, and this one was new to me.
My motivation was that I had two different ranking systems I could use to ORDER a set of rows and I wanted to compare them. This would let me answer questions like “this row is first in this ranking, where is it in the other system?”
I was planning to run both queries and write a program to compare them when I found window functions.
(I’m going to show examples in SQLite, but window functions are broadly supported in most dialects: MySQL, Postgres, Presto, etc.)
You probably know about functions in SQL, which compute a value from the input:
SELECT UPPER('my name'), ROUND(1.248, 2), TRIM('  hello  ');
┌──────────────────┬─────────────────┬───────────────────┐
│ UPPER('my name') │ ROUND(1.248, 2) │ TRIM('  hello  ') │
├──────────────────┼─────────────────┼───────────────────┤
│ 'MY NAME'        │ 1.25            │ 'hello'           │
└──────────────────┴─────────────────┴───────────────────┘
And aggregate functions like COUNT, MIN, and MAX which compute a single value for the entire result set:
SELECT MAX(day_high), MIN(day_low)
FROM weather
WHERE date BETWEEN '2026-01-01' AND '2026-01-31'
AND airport = 'EWR';

┌───────────────┬──────────────┐
│ MAX(day_high) │ MIN(day_low) │
├───────────────┼──────────────┤
│ 54            │ 5            │
└───────────────┴──────────────┘
(values in Fahrenheit—it was a cold winter).
Window functions, in contrast, compute a value for a row relative to other rows in the result set.
For example, consider this weather table:
SELECT * FROM weather;
┌──────────────┬─────────┬──────────┬─────────┐
│     date     │ airport │ day_high │ day_low │
├──────────────┼─────────┼──────────┼─────────┤
│ '2026-01-01' │ 'EWR'   │ 35       │ 20      │
│ '2026-01-02' │ 'EWR'   │ 32       │ 21      │
│ '2026-01-03' │ 'EWR'   │ 32       │ 20      │
│~~~~~~~~~~~~~~~~~~~~~~~~~~~~~~~~~~~~~~~~~~~~~│
│                     ...                     │
│~~~~~~~~~~~~~~~~~~~~~~~~~~~~~~~~~~~~~~~~~~~~~│
│ '2026-01-31' │ 'EWR'   │ 26       │ 5       │
└──────────────┴─────────┴──────────┴─────────┘
Let’s say I want to see the change in the temperature each day. To do that, I need the temperature from the current row and the previous row. You get that with the window function LAG:
SELECT
  date,
  day_high,
  LAG(day_high) OVER (ORDER BY date) AS yesterday_high
FROM weather
WHERE airport = 'EWR'
ORDER BY date;
┌──────────────┬──────────┬────────────────┐
│     date     │ day_high │ yesterday_high │
├──────────────┼──────────┼────────────────┤
│ '2026-01-01' │ 35 ───┐  │ NULL           │
│ '2026-01-02' │ 32    └───▶35             │
│ '2026-01-03' │ 32       │ 32             │
│~~~~~~~~~~~~~~~~~~~~~~~~~~~~~~~~~~~~~~~~~~│
│                   ...                    │
│~~~~~~~~~~~~~~~~~~~~~~~~~~~~~~~~~~~~~~~~~~│
│ '2026-01-30' │ 20 ───┐  │ 24             │
│ '2026-01-31' │ 26    └───▶20             │
└──────────────┴──────────┴────────────────┘
You can see that the day_high for a row becomes yesterday_high for the next row. The value for the first row is NULL because there is no previous row.
To see the change from one day to the next, you can use day_high - LAG(day_high) OVER (ORDER BY date).
- The keyword that signals we’re using window functions is
OVER. - You can create a named window with a
WINDOWclause. - You can use
PARTITION BYto create subsets of rows for comparison (for example, to avoid comparing the weather at one airport to another). - Some common functions are
ROW_NUMBER(the number of a row in its partition set),LAG(previous row, used above), andLEAD(next row).
Even after writing all this up, I have to admit that I have never once written a window function from memory. But with many things, it doesn’t matter if you know how to do it, what matters is that you know it’s possible.
TIL: cmd + shift + 5 is the final screenshot command
I have used Macs forever and at one point I took a lot of pride in the sheer number of keyboard shortcuts I had memorized.
cmd + shift + 3for a full-screen screenshotcmd + shift + 4for a region- press spacebar to switch to object mode (capture a window, menu, etc.)
- less useful, but shift and option change drag mode
- in both modes, hold control to capture to clipboard
Today I discovered cmd + shift + 5 which basically turns knowledge of all these shortcuts into a nice UI:
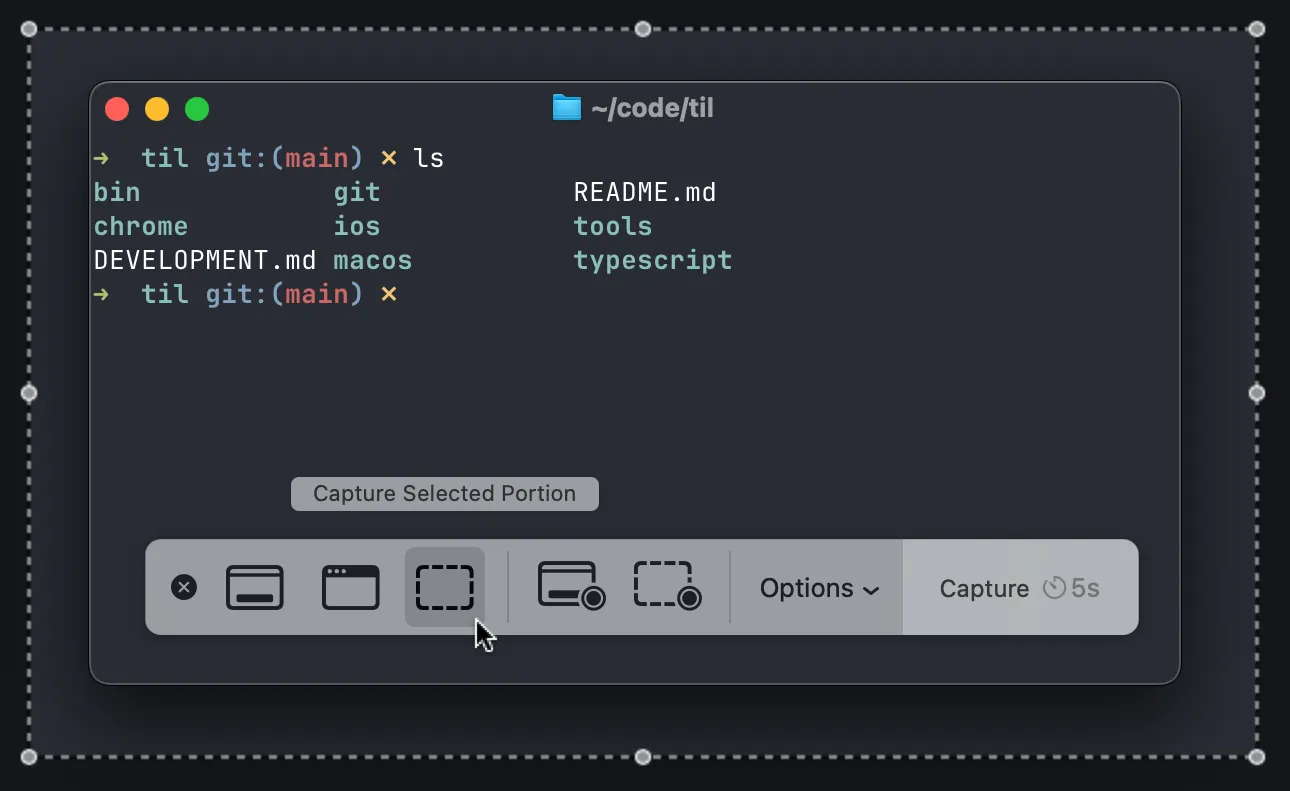
You can capture the entire screen, a region, or a UI element. The Options menu lets you choose where to save it (including the clipboard), set a timer, show or hide the cursor. You can even record a movie!
As a bonus: if you need to take a screenshot of the screenshot controls, I learned you can use the screencapture command:
screencapture -C -T10 ~/Desktop/screencapture_$(date +%s).png-C shows the cursor, -T10 gives you a 10-second delay.
TIL: Find my own commits
The --author flag for git log lets you filter commits by a specific person. It matches the entire author line so you can search for the name or email address: git log --author Alice and git log --author bob@example.com both work. From the man page:
--author=<pattern>, --committer=<pattern>
    Limit the commits output to ones with author/committer header lines that match the <pattern> regular
    expression. With more than one --author=<pattern>, commits whose author matches any of the <pattern> are
    chosen (similarly for multiple --committer=<pattern>).
Of course, being egocentric, the author I am most interested in is myself. I made this alias to find my own commits:
alias glm="git log --author=$(git config user.name)"I use this all the time to jog my memory (“What have I merged recently?” glm origin/main) and to dig up changes I remember making, by combining with other filters:
git log --grepto search commit messagesgit log -S(the “pickaxe”) to searches for commits that added or removed a fragment of code, ignoring when it simply moved around in a file.git log [file path]to find places I changed a certain file or directory
You can use --author multiple times with OR semantics: git log --author Alice --author Bob. It accepts regular expressions when combined with -E: git log -E --author "Alice|Bob|Eve" finds commits from all three people.
TIL: Use "Invisible Ink" for spoilers in iMessage
Earlier this week I remarked to a friend that I wish iMessage had spoiler formatting like Discord. They responded

What!? Woah!
I used to be on the vanguard of new features in macOS/iOS but maybe that day has passed. To send a message with this effect (which applies to the entire message, not selectively), you long press on the send button and select the “Invisible Ink” effect.
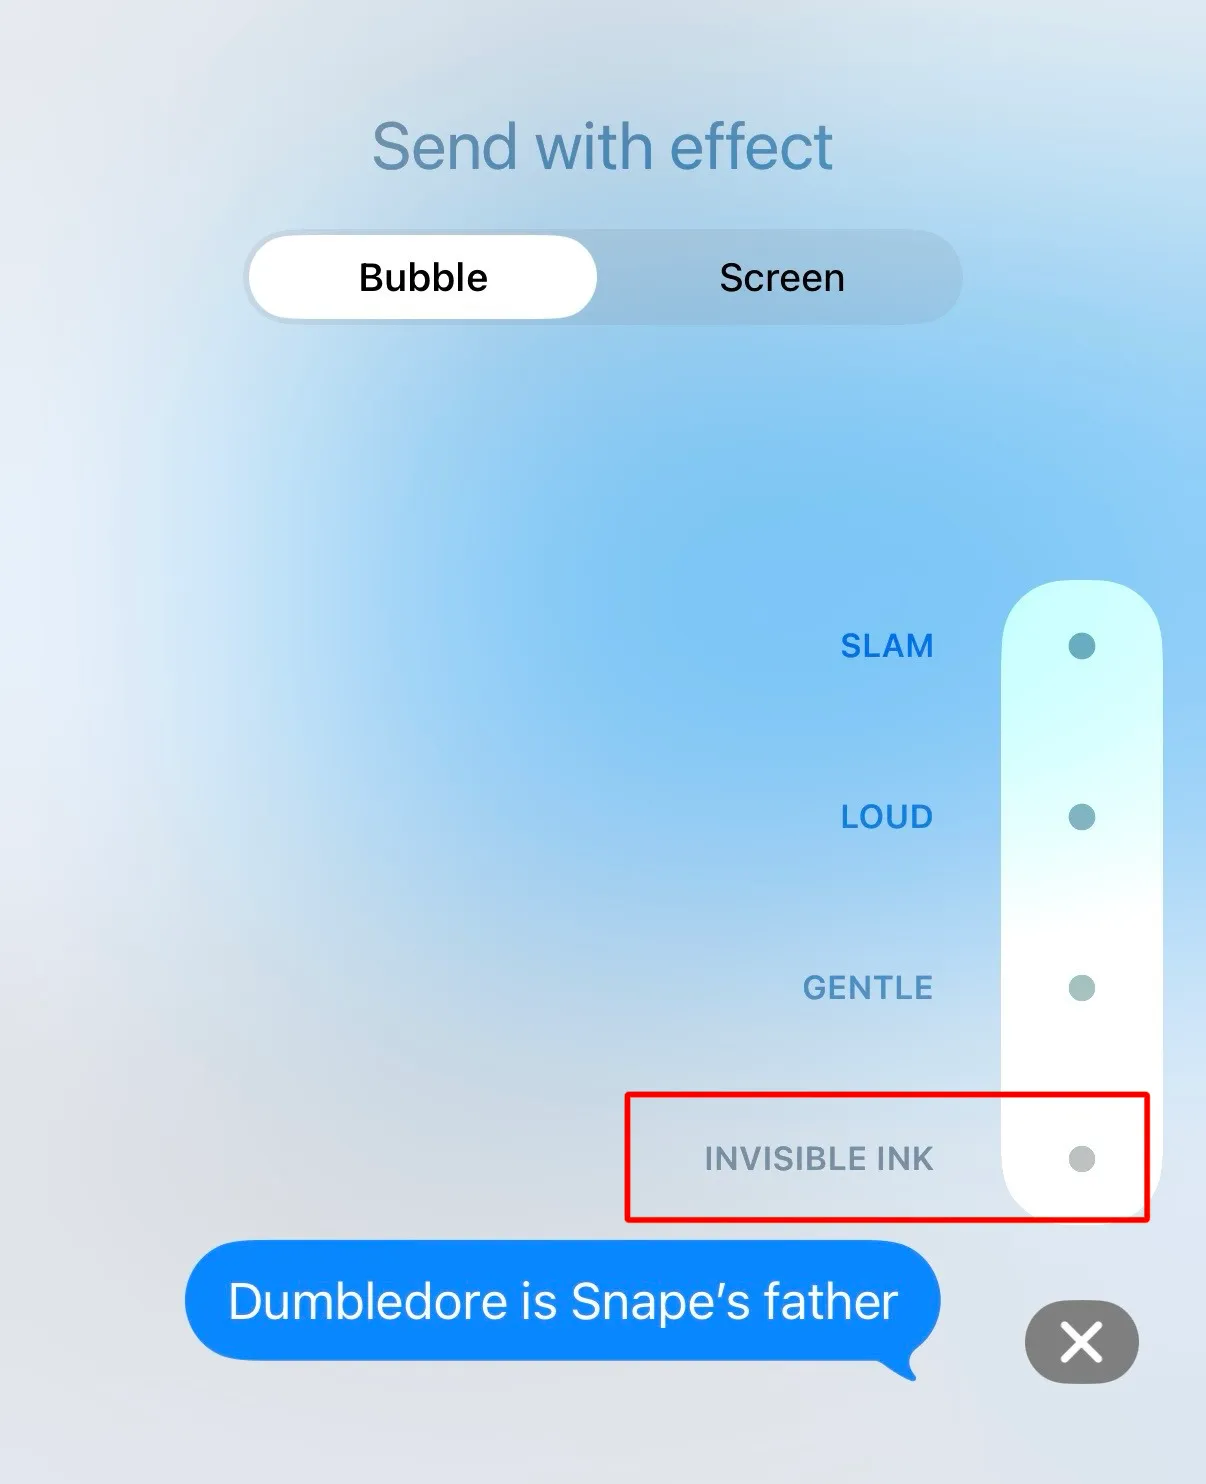
It also works on pictures.
TIL: termgraph for CLI charts
I love git archaeology so I enjoyed the commands Ally Piechowski shared in The Git Commands I Run Before Reading Any Code.
This one shows you the monthly commits in a repository:
git log --format='%ad' --date=format:'%Y-%m' | sort | uniq -cFor example, in the open-source sentry codebase:
git log --after '2024-06-01' --format='%ad' --date=format:'%Y-%m' | sort | uniq -c
1231 2024-06
1334 2024-07
1012 2024-08
1077 2024-09
1242 2024-10
1029 2024-11
 911 2024-12
1408 2025-01
1403 2025-02
1777 2025-03
1980 2025-04
1594 2025-05
1738 2025-06
1816 2025-07
1202 2025-08
1765 2025-09
1557 2025-10
1282 2025-11
1153 2025-12
1459 2026-01
1302 2026-02
1841 2026-03
 471 2026-04
It’s easier to see numbers than read and compare, so I went looking for CLI charts and found termgraph, a Python CLI and library. In the past I have been somewhat reluctant to use Python CLIs because I get into messes with pip install and environments, but when combined with uvx it’s easy to use:
git log --after '2024-06-01' --format='%ad' --date=format:'%Y-%m' | sort | uniq -c  | awk '{print $2, $1}' | uvx termgraph
2024-06: ▇▇▇▇▇▇▇▇▇▇▇▇▇▇▇▇▇▇▇▇▇▇▇▇▇▇▇▇▇▇▇ 1.23 K
2024-07: ▇▇▇▇▇▇▇▇▇▇▇▇▇▇▇▇▇▇▇▇▇▇▇▇▇▇▇▇▇▇▇▇▇ 1.33 K
2024-08: ▇▇▇▇▇▇▇▇▇▇▇▇▇▇▇▇▇▇▇▇▇▇▇▇▇ 1.01 K
2024-09: ▇▇▇▇▇▇▇▇▇▇▇▇▇▇▇▇▇▇▇▇▇▇▇▇▇▇▇ 1.08 K
2024-10: ▇▇▇▇▇▇▇▇▇▇▇▇▇▇▇▇▇▇▇▇▇▇▇▇▇▇▇▇▇▇▇ 1.24 K
2024-11: ▇▇▇▇▇▇▇▇▇▇▇▇▇▇▇▇▇▇▇▇▇▇▇▇▇ 1.03 K
2024-12: ▇▇▇▇▇▇▇▇▇▇▇▇▇▇▇▇▇▇▇▇▇▇▇ 911.00
2025-01: ▇▇▇▇▇▇▇▇▇▇▇▇▇▇▇▇▇▇▇▇▇▇▇▇▇▇▇▇▇▇▇▇▇▇▇ 1.41 K
2025-02: ▇▇▇▇▇▇▇▇▇▇▇▇▇▇▇▇▇▇▇▇▇▇▇▇▇▇▇▇▇▇▇▇▇▇▇ 1.40 K
2025-03: ▇▇▇▇▇▇▇▇▇▇▇▇▇▇▇▇▇▇▇▇▇▇▇▇▇▇▇▇▇▇▇▇▇▇▇▇▇▇▇▇▇▇▇▇ 1.78 K
2025-04: ▇▇▇▇▇▇▇▇▇▇▇▇▇▇▇▇▇▇▇▇▇▇▇▇▇▇▇▇▇▇▇▇▇▇▇▇▇▇▇▇▇▇▇▇▇▇▇▇▇▇ 1.98 K
2025-05: ▇▇▇▇▇▇▇▇▇▇▇▇▇▇▇▇▇▇▇▇▇▇▇▇▇▇▇▇▇▇▇▇▇▇▇▇▇▇▇▇ 1.59 K
2025-06: ▇▇▇▇▇▇▇▇▇▇▇▇▇▇▇▇▇▇▇▇▇▇▇▇▇▇▇▇▇▇▇▇▇▇▇▇▇▇▇▇▇▇▇ 1.74 K
2025-07: ▇▇▇▇▇▇▇▇▇▇▇▇▇▇▇▇▇▇▇▇▇▇▇▇▇▇▇▇▇▇▇▇▇▇▇▇▇▇▇▇▇▇▇▇▇ 1.82 K
2025-08: ▇▇▇▇▇▇▇▇▇▇▇▇▇▇▇▇▇▇▇▇▇▇▇▇▇▇▇▇▇▇ 1.20 K
2025-09: ▇▇▇▇▇▇▇▇▇▇▇▇▇▇▇▇▇▇▇▇▇▇▇▇▇▇▇▇▇▇▇▇▇▇▇▇▇▇▇▇▇▇▇▇ 1.76 K
2025-10: ▇▇▇▇▇▇▇▇▇▇▇▇▇▇▇▇▇▇▇▇▇▇▇▇▇▇▇▇▇▇▇▇▇▇▇▇▇▇▇ 1.56 K
2025-11: ▇▇▇▇▇▇▇▇▇▇▇▇▇▇▇▇▇▇▇▇▇▇▇▇▇▇▇▇▇▇▇▇ 1.28 K
2025-12: ▇▇▇▇▇▇▇▇▇▇▇▇▇▇▇▇▇▇▇▇▇▇▇▇▇▇▇▇▇ 1.15 K
2026-01: ▇▇▇▇▇▇▇▇▇▇▇▇▇▇▇▇▇▇▇▇▇▇▇▇▇▇▇▇▇▇▇▇▇▇▇▇ 1.46 K
2026-02: ▇▇▇▇▇▇▇▇▇▇▇▇▇▇▇▇▇▇▇▇▇▇▇▇▇▇▇▇▇▇▇▇ 1.30 K
2026-03: ▇▇▇▇▇▇▇▇▇▇▇▇▇▇▇▇▇▇▇▇▇▇▇▇▇▇▇▇▇▇▇▇▇▇▇▇▇▇▇▇▇▇▇▇▇▇ 1.84 K
2026-04: ▇▇▇▇▇▇▇▇▇▇▇ 471.00
The default formatting for termgraph is "{:<5.2f}". I tried to fix 538.00 to 538 with --format '{:.0f}' but that also truncated 1.78K to 1K. Then I found --format {:g}, which strips trailing zeros so 1.82 is still rendered as 1.82 but 538.00 becomes 538. ‘g’ is the “general format”.
TIL: oxipng and pngquant to compress PNGs
The last time I needed to optimize image sizes was quite some time ago. With this kind of thing, if you wait long enough, a better tool will be available. Last time I remember using pngcrush; now there’s oxipng for lossless compression and pngquant for lossy compression.
I tried this with a small screenshot:
$ du -h *
 92K    screenshot.png

$ oxipng screenshot.png --out screenshot-oxipng.png
Files processed: 1/1
Input size: 89.7 KiB (91873 bytes)
Output size: 50.3 KiB (51482 bytes)
Total saved: 39.4 KiB (43.96%)

$ pngquant screenshot.png --output screenshot-pngquant.png

$ du -h * | sort -h
 32K    screenshot-pngquant.png
 52K    screenshot-oxipng.png
 92K    screenshot.png
The original was 92K, the lossless oxipng version is 52K (57%), and the oxipng version is 32K (35%). I could not identify any visual differences looking at the lossy pngquant version versus the original.
TIL: tldr for simpler, example-driven help
If you type help in most shells what you get is not very helpful:
$ help
zsh: command not found: help
bash is slightly better; fish is actually good.
Eventually you learn that help is obtained from the manual by running man. After you chuckle at the combinations this permits—man less, man cat, man man, man date—you confront a second reality which is that the manual can be overwhelming to the point of not being helpful.
$ man ls

NAME
     ls – list directory contents

SYNOPSIS
     ls [-@ABCFGHILOPRSTUWabcdefghiklmnopqrstuvwxy1%,] [--color=when] [-D format] [file ...]

[...]
Enter tldr pages, “collaborative cheatsheets for console commands,” which provide a few examples of common usage. Here’s the page for ls:
$ tldr ls

ls

List directory contents.
More information: <https://www.gnu.org/software/coreutils/manual/html_node/ls-invocation.html>.

- List files one per line:
    ls -1

- List all files, including hidden files:
    ls [-a|--all]

- List files with a trailing symbol to indicate file type (directory/, symbolic_link@, executable*, ...):
    ls [-F|--classify]

- List all files in [l]ong format (permissions, ownership, size, and modification date):
    ls [-la|-l --all]

- List files in [l]ong format with size displayed using human-readable units (KiB, MiB, GiB):
    ls [-lh|-l --human-readable]

- List files in [l]ong format, sorted by [S]ize (descending) recursively:
    ls [-lSR|-lS --recursive]

[...]
You can install tldr with your package manager (e.g. brew install tldr) or read at https://tldr.inbrowser.app. It’s easy to contribute new commands and examples; I always forget how to use units so I added examples to tldr.